Week 1- Essentials to work in R
Following the delivery of a series of workshops on forecasting using R in the developing countries-please see democratising forecasting section- and some other organisations such as NHS in the UK, I am going to publish series of weekly posts (every Friday) to make them accessible to a wider audiance. Throughout these posts you can develop skills and knowledge to successfully prepare, visualise, analyse and model time series data and generate forecasts to support planning and decision making process.
These series of pots might be interested to learners interested in forecasting, especially those working with sub-daily data in the healthcare sector.
We have also created a new community dedicated to forecasting in healthcare. You can also use this discussion community to ask questions related to these series of posts.
Please join the community and create a topic to start a discussion. The community aims to provide a platform for forecasters, researchers and practitioners to question, discuss, share and debate. The community is not limited to forecasting using R or any particular methodology.
In this post, I present some general information. I also provide an introduction to R that covers essentials to work with R which is essential for future posts. If you are comfortable or skilled in R, then you can skip this post!
Learning outcomes
By the end of this post, you should be able to:
- Describe forecasting steps
- Create a project in RStudio and argue why it is important
- Discuss three main tasks in data analysis with R
- Describe important things to know in R
- Create a new R script and RMarkdown file
- Install and load packages
1 Forecasting task
In any given forecasting task, we need to go thorugh the follwing steps:
- Define what to forecast based on the decisions and planning
- Gather relevant data/information
- Prepare data
- Visualise data
- Specify models and estimate parameters
- Evaluate modeling accuracy
- Communicate and use forecast
These steps are not necessarily accomplished in a serial sequence and could be an iterative process.
In my forecasting using R workshops, we go through all these steps, however due to the time constraint, we do not go in detail through those steps related to defining what to forecast and gather relevant data/information. However, these are two crucial steps without which any forecasting task is impossible or useless. I will write about these two steps in close feature.
1.1 Case study
Throughout these series of posts, we refer to a scenario from Emergency departement of a hospital using a real dataset.
Scenario:
A TV news report about the performance of Accident and Emergency units in the National Health Service (NHS) during the winter period has just been broadcast. The report claims that A&E units have recorded their worst performance since current records began. The Department of Health and Social Care says this is in part due to unprecedented demand for services during the period. He adds the forecast for future demand will be also increasing. Is this a fair argument? Can we accurately forecast A&E future attedance to improve the service? As a data analyst or forecaster, you have been provided with the A&E attendance from your local informatic service. Your task is to prepare a report to check the validity of this argument by analysing, visualising the past A&E attendance, highlighting key features of past A&E attendance and proposing a forecasting model that forecast future attendance accurately.
2 Essentials to work with R
If you are familiar with R, you can skip this and wait for the upcoming posts. If you are a learner or with a basic knowledge of R, you need to ensure that you are equipped with essentials to work with R.
2.1 R and Rstudio
Remember when you started learning a new language, was it easy to speak and communicate from the first day? I speak few languages and the answer is NO!
R is a (programming) language You need to learn grammar, voclabulary, structure, practice, etc to be able to communicate with R. You can ask R any question (we call it code) if it is in the right syntax then R will reply, otherwise it will tell you that there is a mistake (give you an Error)! Find out reasons to use R.
You can download r software and install it. Once finished, open it. Do you like the interface to do your work? This is the basic R Graphical User Interface (GUI). Ofcourse, you can work on it if you like, however it is not user friendly.

Instead, I recommend using Rstudio which is a user friendly interface to work with. You can download the free version of RStudio and install it. Find out more about reasons to use RStudio.
Once you install R and Rstudio, you can open Rstudio. The following figure shows what icon you should be clicking on your computer.
![]()
You can watch this video to know more about the RStudio enviroment.
2.2 Always start by creating a project
Creating a project must be the first thing you do whenever starting a new task/project.
To craete a project: 1) open RStudio, 2) click on File -> New project
You need to choose a Directory name for your project(e.g. forecasting_using_r) and then click on Browse and select a location in your computer which becomes the project directory. Finally click on Create Project.
You can find more details here
Whenever you want to work on the project, you need to open it by double clicking/choosing
.Rprojfrom the project directory
2.2.1 Benefits of creating a project
There are many benefits in creating project. It:
- automatically sets the project directory as Working directory
- makes reading files into R and writing outputs into project directory easy
- allows you to use absolute path instead of exact path
- allows you to work on multiple projects at the same time
- helps you to organise all your files in the same directory
Perhaps, the most important one is setting automatically the working directory.
2.2.2 What is working directory
The working directory is a file path on your computer that sets the default location of any files you read into R, or save out of R. In other words, a working directory is like a little flag somewhere on your computer which is tied to a specific analysis project.
If you ask R to import a dataset from an Excel file, or save a graph as a JPEG file, it will assume that the file is inside your working directory. You need to have a separate working directory for each project. In R, we also talk about file paths – this is the route taken to a file or directory. There are two kinds of path. An absolute or exact file path describes how to access a given file or directory, starting from the root of the file system. For example: “D:/My project/NHS-diploma/data/ae.csv”
A relative file path is interpreted from the perspective of your current working directory. For example: “data/ae.csv”
2.3 Deciding on how to do things in R
Once you created the project, you are ready to start the project. But, what do you need to do? In any data related project including forecasting in R, you almost do three tasks:
You write codes which are a set of instruction through which you tell R what you want to do. You write lots of codes for your project and different purposes: to import data, to tidy data, remove missing values, fill gaps, change names, create new variables, produce graphs, apply models, analyse output of models, generate forecasts and more.
You will run your codes to get outputs such as tables, graphs, model’s fit, forecasts, forecast accuracy table, etc. often you look at these results, try to understand them and see if they make sense, if your happy with them and you can explain them or not, if they are intutive or not, etc and you may go back and change things which happend alot in any project.
Finally, you want to explain in plain text what you have done, you want to interpret results produced as tables, graphs and put them together as a report and communicate it with various audiances in different formats such as Pdf, Word, html.
Now, you can try these three tasks in a variaty of ways such as using Console, R script and RMarkdown. Console is mainly used for quick tests or larning purposes. Once you become an expert in R, it is common to write many R scripts and use them in RMarkdown, so both are equally important.
2.4 Console
Console pane is a place where you enter your code and run it. Running a code is the act of telling R to perform an act by giving it commands in the console. Once you open RStudio, R awaits your instructions at a command line of its own, denoted by the right angle bracket symbol, >. When you type an instruction and hit return, R interprets it and sends any resulting output back to the console.
You’ll frequently use the Console to check your work or thoughts on how to solve a problem using R. However, using Console in not recommended for data analysis projects because whatever you type in Console will be forgotten once you close Rstudio which means you cannot work on it later. It is not only impractical, but also not adapted to working with projects which require more than a few lines of commands.
Note: All three main tasks are not connected when using Console.
You can read more about basic work flow here.
2.4.1 Rscript
To create an R script, you can use keyboard shortcut Cmd/Ctrl + Shift + N or by clicking on File -> New File -> R Script.
More infromation about R script is available here
If you use only R Script, the three tasks are not connected, you can not write plain text there except in the form of comments.
2.5 RMarkdown
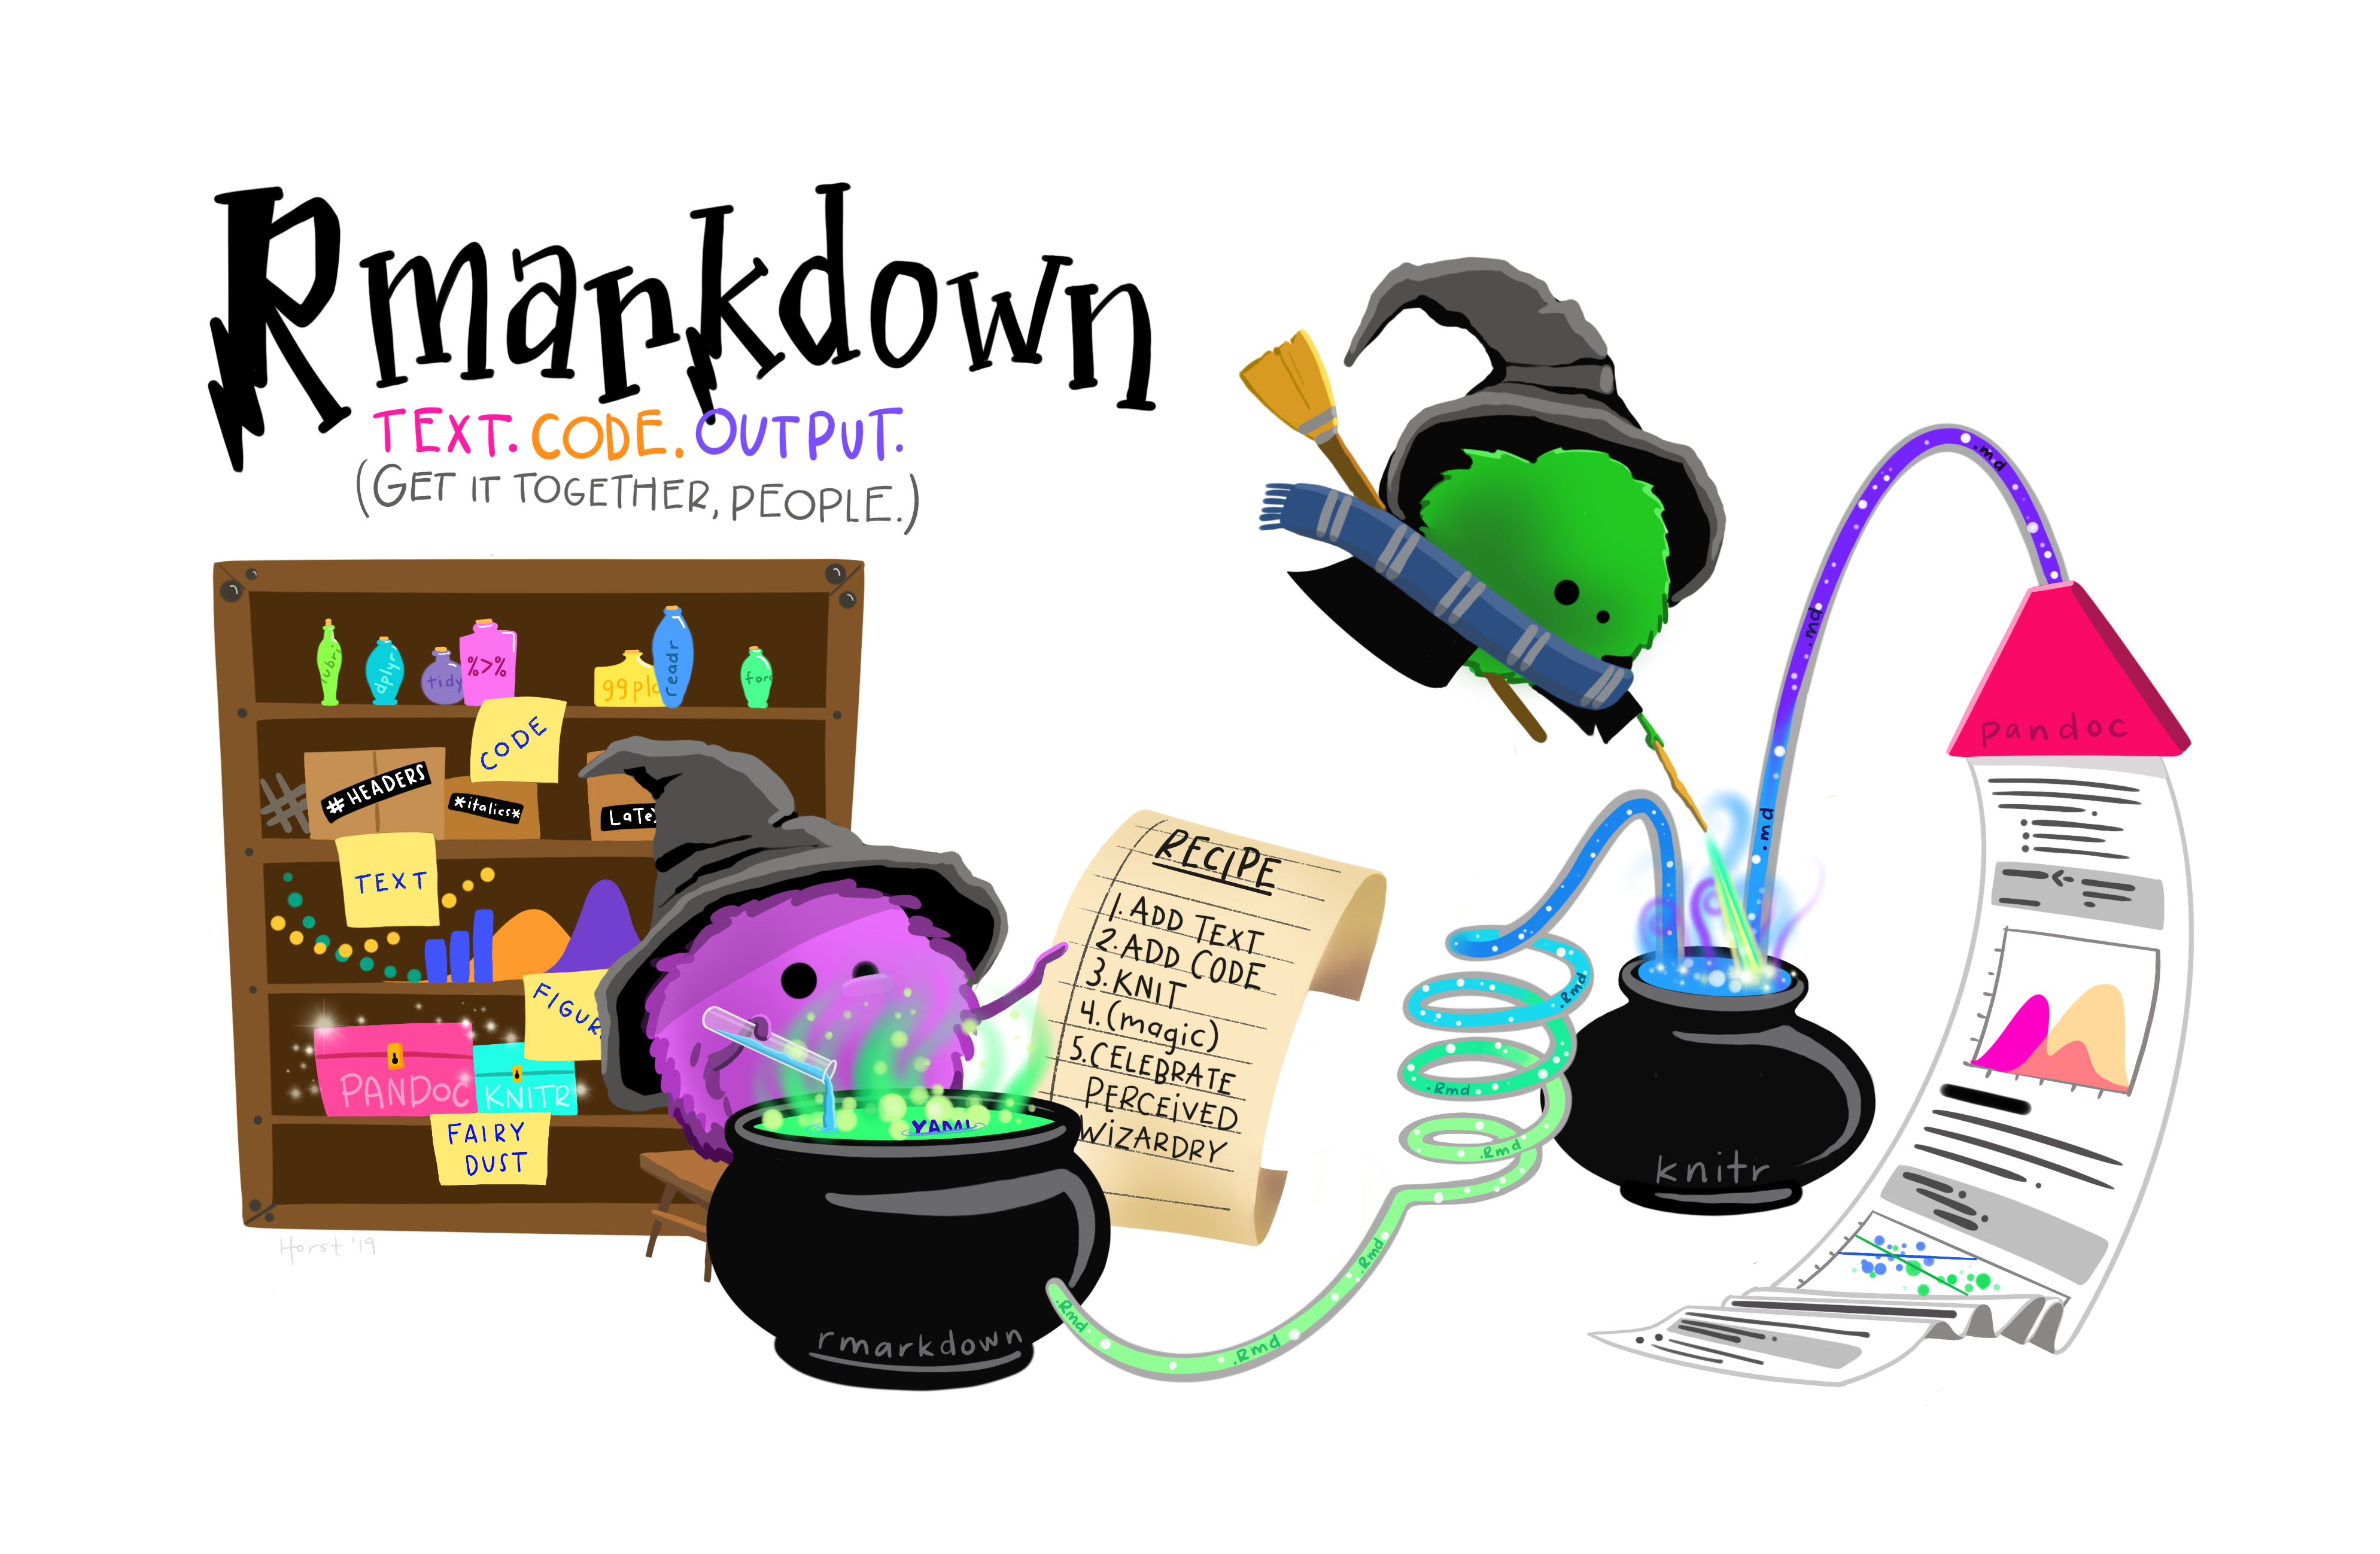
My recommendation is to start using RMarkdown. Using RMarkdown helps you to combine the three tasks in one single file. This is crucial for reproducibility and transparency. Moreover, you can get many different outputs from the same RMarkdown file such as Pdf, Word, html, presentation and more. later on, you can use it to write your report, paper, book and even write posts in your website such as mine.
If you want to share what you have done:
- with someone who understands R Codes, share
.Rmdfile, - with someone who is only interested in results and not how you done it, get pdf/ Word/html and then share it.
In Rmarkdown, all three tasks are connected together.
To create a new Rmarkdowm file: click on File -> New File -> R Markdown
You need to choose a title(e.g. prepare_data_part1) and then click on OK button. Save the file into your project directory! in the Save As: box, type the same title (e.g. prepare_data_part1). Delete everything after ## R Markdown in the file and click on save button.
Benefit of using RMarkdown
- Combine three mains tasks in one file
- Ultimate tool for reproducible and transparent reports
- Produce various outputs such as pdf, html, word and presentation
- Avoid using multiple software and tools for data analysis journey
R Markdown files are designed to be used in three ways:
- For communicating to decision makers, who want to focus on the conclusions, not the code behind the analysis.
- For collaborating with other colleague, who are interested in both your conclusions, and how you reached them ( i.e. the code).
- As a modern day lab notebook where you can capture not only what you did, but also what you were thinking.
More information about RMarkdown can be found here
Note: In practice, you would use a combination of Console, R script and Rmarkdown when doing your project.
3 Important things to know about R
Any new piece of software takes a bit of getting used to. This is especially true when using an IDE to work in a language like R. You are getting oriented to the language itself (what happens at the console), while learning to take notes in what might seem like an odd format (chunks of code interspersed with plain-text comments), in an IDE that has many features designed to make your life easier in the long run, but which can be hard to decipher at the beginning.
Here are some general points to bear in mind about how R is designed. They might help you get a feel for how the language works.
3.1 Everything has a name
In R, everything you deal with has a name. You refer to things by their names as you examine, use, or modify them. Named entities include variables (e.g. x, or y), data that you have loaded (e.g. my_data), and functions that you use.
- Names in R are case sensitive. The object
my_datais not the same as the objectMy_Data. - When choosing names for things, be concise, consistent, and informative.
- Follow the style of the tidyverse and name things in lower case, separating words with the underscore character,
_, as needed. - You can combine multiple words in naming, e.g.
word1_word2_word3 - Do not use spaces when naming things, including variables in your data.
3.2 Everything is an object
Whatever we name in R becomes an object. You create objects by assigning them to names as:Object_name <- value
When you create objects by assigning things to names, they come into existence in R’s workspace or environment. Some objects are built in to R, some are added via libraries, and some are created by the user. But almost everything is some kind of object. The code you write will create, manipulate, and use named objects as a matter of course.
If you’re not sure what an object is, ask for its class:
- Every object has a class. This is the sort of object it is, whether a vector, a character string, a function, a list, and so on. Knowing an object’s class tells you a lot about what you can and can’t do with it:
class(object)
To see inside an object, ask for its structure. The str() function is sometimes useful. It lets you see what is inside an object.
3.3 You do things using functions
You do almost everything in R using functions. Think of a function as a special kind of object that can perform actions for you. It produces output based on the input that it receives. When we want a function to do something for us, we call it by typing its name, e.g. read_csv().
Functions can be recognized by the parentheses at the end of their names. This distinguishes them from other objects, such as single numbers, named vectors, tables of data, and so on. The parentheses are what allow us to send information to the function.
We give the function some information, it acts on that information, and some results come out the other side. Information given to functions through arguments. Most functions accept one or more named arguments. A function’s arguments are the things it needs to know in order to do something. Functions take inputs via their arguments, do something, and return outputs. we call the output of a function a value. The value depends on what the function does.
How to use functions
We call functions by typing their names and providing arguments. Functions can return one or many values. The output returned by functions can be a table of data, or a complex object such as the results of a linear model, or the instructions needed to draw a plot on the screen (as we shall see).
- Use arguments in fucntions:
- By position
- By name
When you install R, you get automatically access to some packages and functions. This is base R.
The code you write will be more or less complex depending on the task you want to accomplish. so, functions available in base R might not be enough. Therefore, you will probably end up writing your own functions to produce the results that you need. But as with other programming languages, you will not have to do everything yourself. Families of useful functions are bundled into packages that you can install, load into your R project, and make use of as you work.
4 Install and load packages
4.1 What is a package?
A collection of R objects in a special format that may include:
- Functions
- Build-in data set
- Help files
- Compiled code
- Package
Installing a package will bring it from a server into your computer. Once the packages is installed, there is no need to reinstall it. You can update it through Tools -> check for package update.
R comes with some standard packages that are installed when you install R. However, many packages do not come with the standard installation of R, so you need to install them yourself. so let’s see how to install packages.
4.2 How to install packages
If the package is stable and available in CRAN, then:
- On the
Packagestab, click onInstall packages, a new window appears. type the name of packages you need to install and click on the install button(make sureinstall dependenciesis checked). - Go to
Tools-> Install Packages - Install packages using
install packagesfunction.
# use install.packages()
install.packages("tidyverse", dependencies=TRUE)# install tidyverse package
installed.packages()# list of installed packages
You can also install the development version of a package from from GitHub:
- Install remote package using
install.packages("remotes") - then use remotes::install_github(“repositoryName/packageName”), e.g. remotes::install_github(“tidyverse/dplyr”)
4.3 Load packages
Installing a package does not mean that the package is available for use in your project. To make a whatever is in a package available for your project, you need to load it. Each time you quit R and reopen it, you need to load packages. The command to load a package is library(packageName).
library("tidyverse")# load a package calles forecast
search()# List of loaded packages
5 Getting help in R
- If you need help about function
read_csv, then use ?read_csv in Console - If you want to see an example of function
read_csv(), then use example(read_csv) - If you get stuck and need to search for help, search google but include ‘r help’ before your keywords
- Ask your questions at stack overflow
- Ask your questions at Rstudio community
6 Be patient with R, and with yourself
- From simple typos to big misunderstandings, mistakes are a standard part of the activity of programming. So, just try to be patient with yourself and with R while you use it.
- Expect to make errors, and don’t worry when that happens. You won’t break anything.
- Each time you figure out why a bit of code has gone wrong you will have learned a new thing about how the language works.
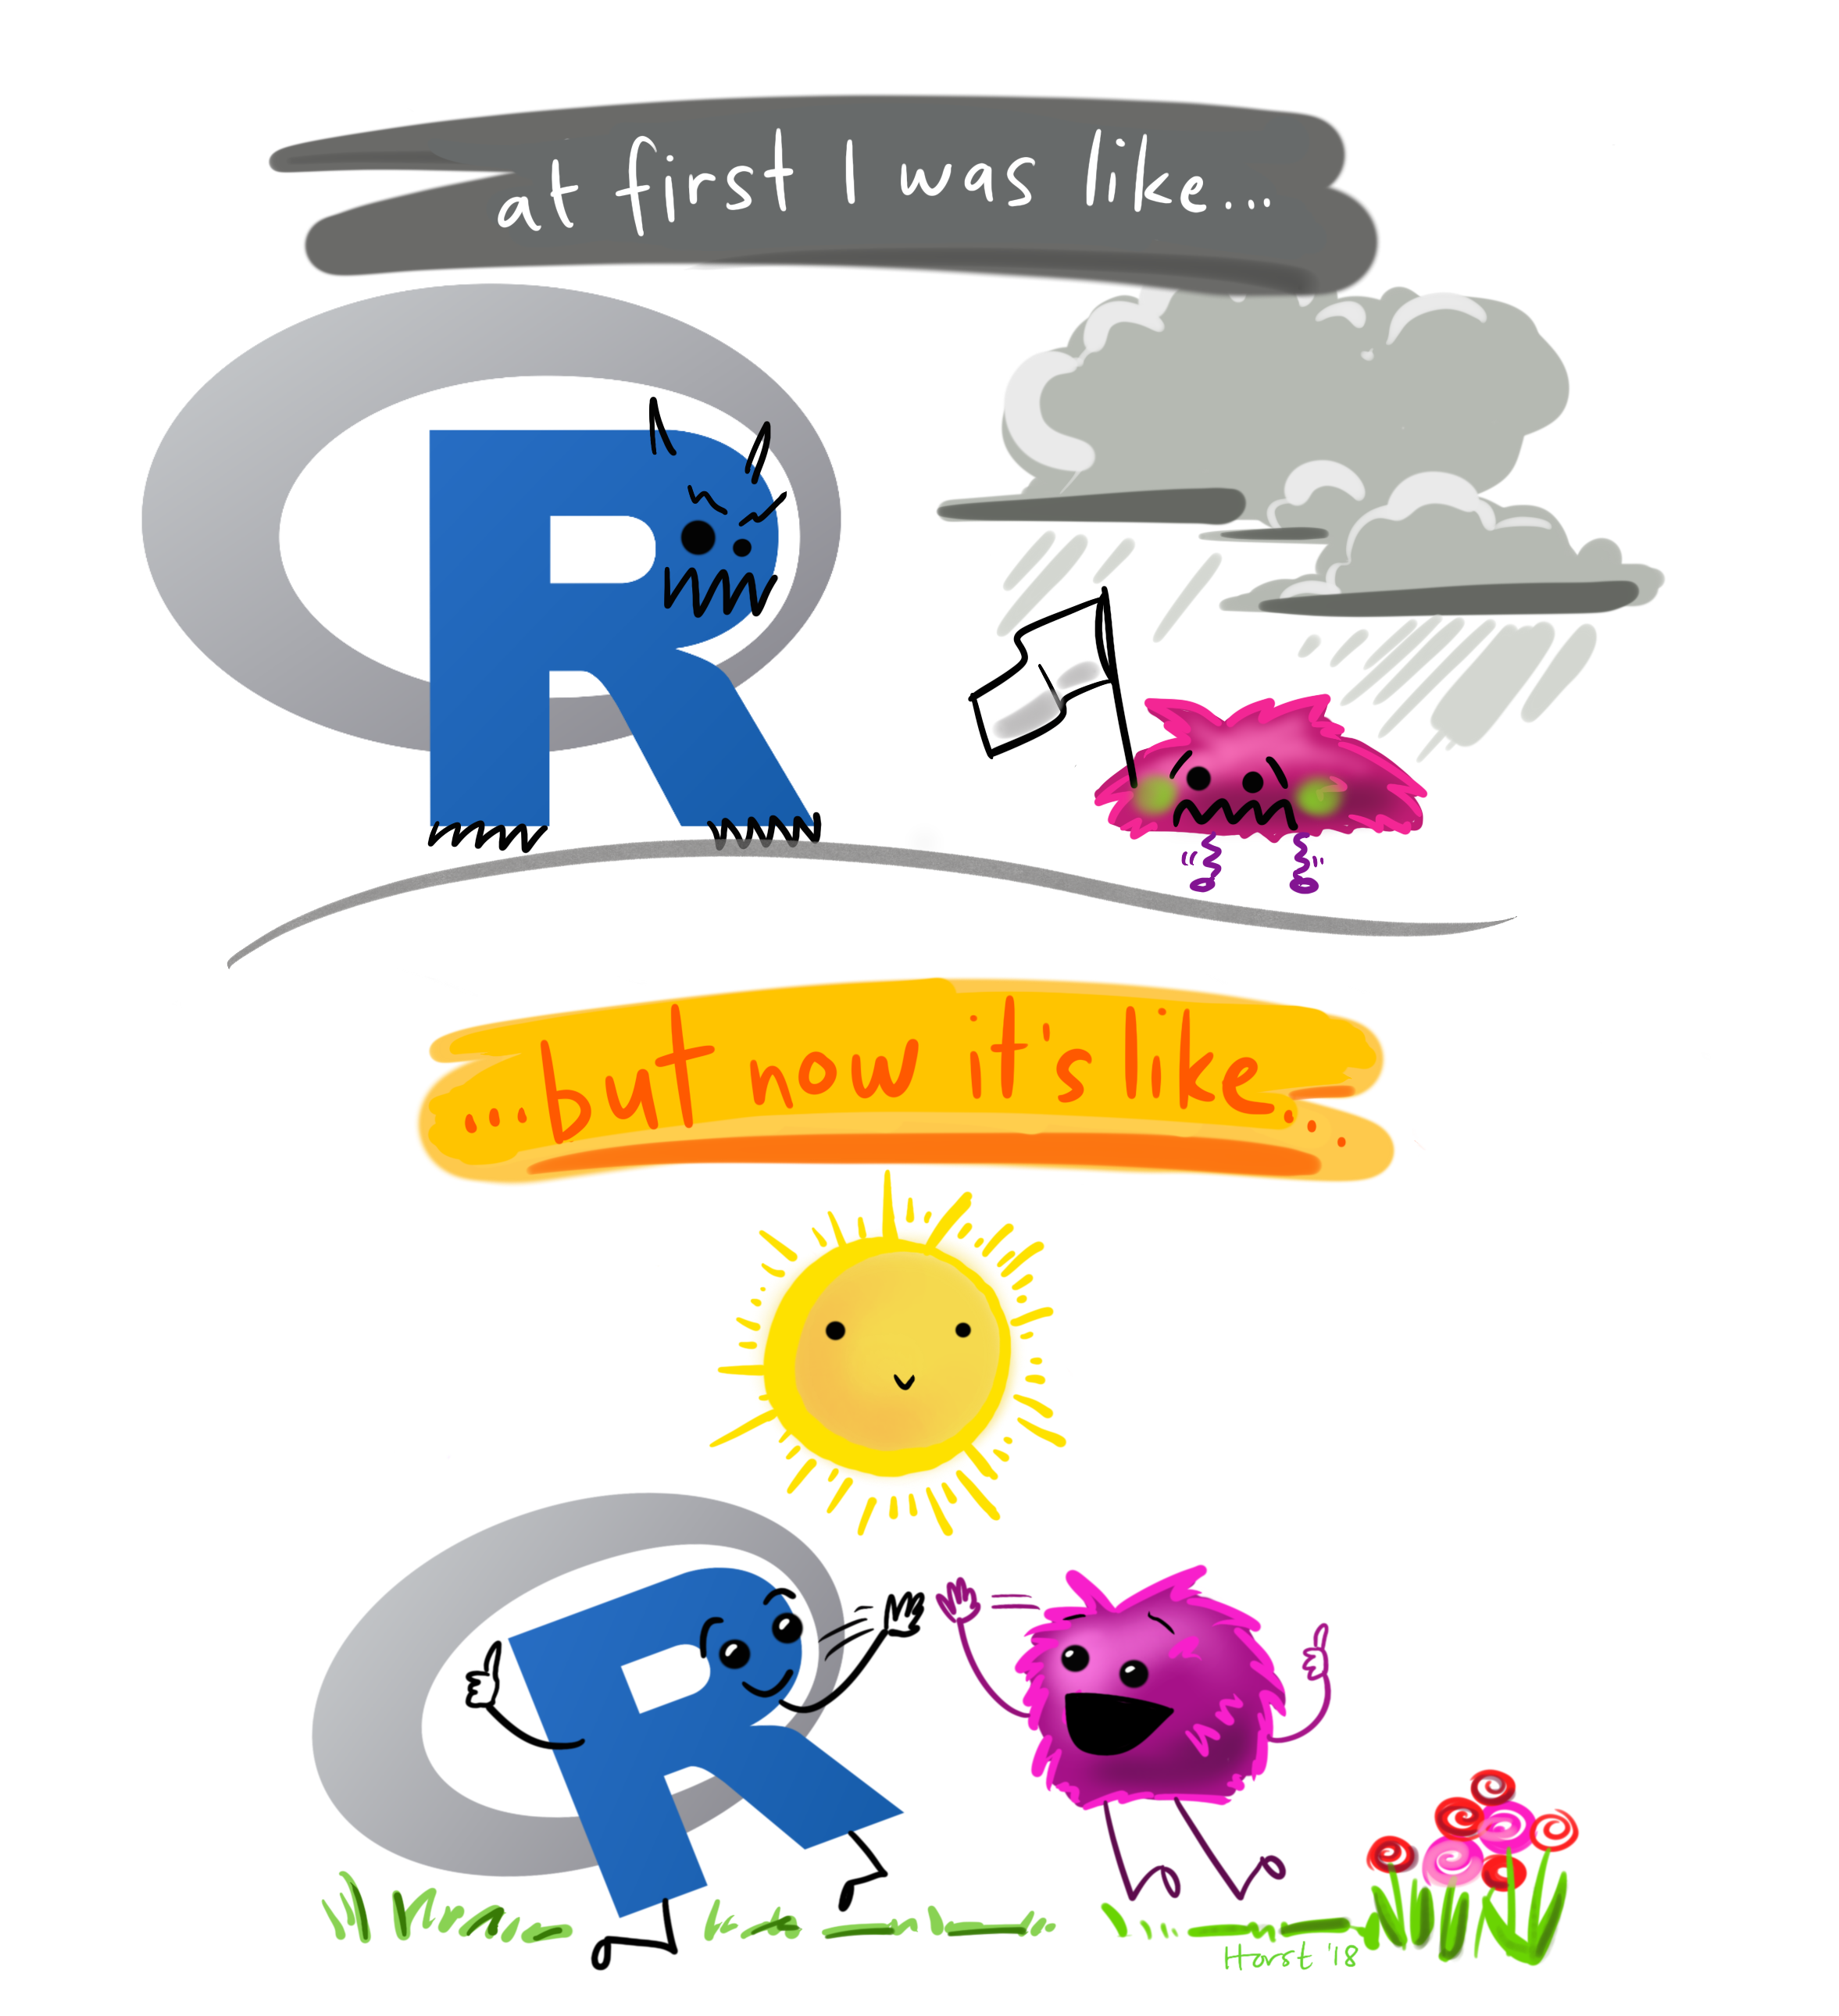
Figure 6.1: by: Allison Horst
7 Next blog
In this post, I have briefly discussed essentials to start working with R. In the next post, we import our dataset into R and start preparing it for more analysis. We work with a real data set containing 773,779 attendance from an Emergency departement over 5 years. The data set contains the following information: the arrival time of a visitor, age, gender and the tyep of injury.
8 Github for forecasting using R
You can clone or download the repository for forecasting using r and work on it on your own. This will include all weekly analysis.
9 References
- R for data Science
- Data Visualization
- [stats-illustrations, Allison Hurst] (https://github.com/allisonhorst)